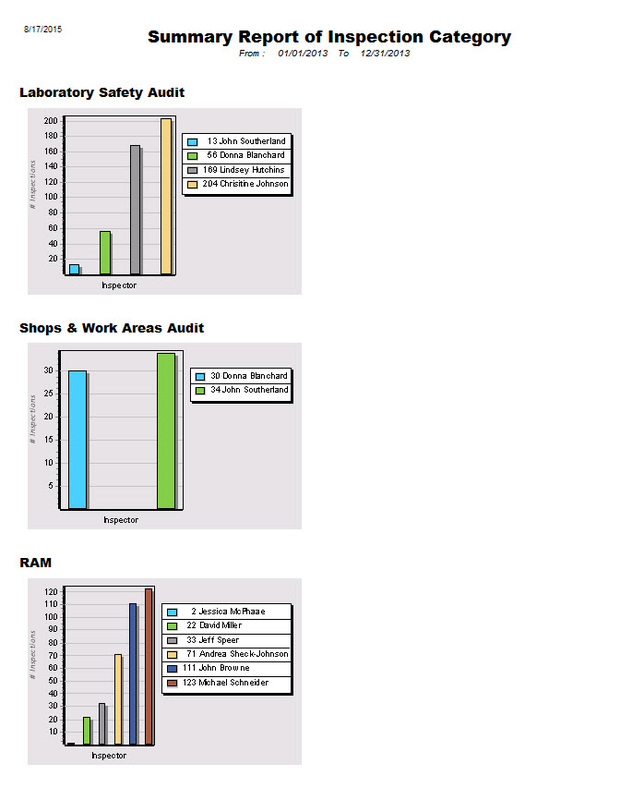
Reporting Using Charts
The newly added feature being added to the new release of the EH&S Assistant is the ability to display, report, and print Charts. These charts can be linked to any of the applications that are part of the EH&S Assistant. The feature allows for the definition of a query that will summarize the reporting structure that was defined. The creator of the chart can select the type of chart along with the results of the query. These queries are typically summary reporting results by application and by time frame. An example listed below shows an inspection result for a reporting period summarizing the number of inspections conducted by each inspector for a specific inspection category. These charts can auto populate on the created form with multiple records per page or separate results reported for each page.